AtomAI
AtomAI is a premium AI-powered SaaS template designed to be a modern, world-class website, suitable for startups, SaaS, and AI-related businesses.
<hr>
<script src="https://cdnjs.cloudflare.com/ajax/libs/d3/7.8.5/d3.min.js"></script>
  <style>

    .container {
      max-width: 900px;
      margin: 0 auto;
      padding: 20px;
    }

    .chart-container {
      background-color: #fff;
      border-radius: 8px;
      box-shadow: 0 2px 4px rgba(0,0,0,0.05);
      overflow: hidden;
    }

    .chart-area {
      width: 100%;
      height: 520px;
      position: relative;
    }

    .legend {
      display: flex;
      flex-wrap: wrap;
      justify-content: center;
      gap: 32px;
      padding: 0 20px 15px 20px;
    }

    .legend-row {
      display: flex;
      flex-wrap: wrap;
      justify-content: center;
      gap: 32px;
      margin-bottom: 12px;
    }

    .legend-item {
      display: flex;
      align-items: center;
      cursor: pointer;
      transition: opacity 0.2s ease;
    }

    .legend-icon {
      width: 20px;
      height: 20px;
      border-radius: 50%;
      margin-right: 10px;
    }

    .legend-text {
      font-size: 1.1rem;
      transition: font-weight 0.2s ease;
    }

    .note {
      text-align: center;
      font-size: 0.875rem;
      color: #6b7280;
      margin-top: 4px;
      padding-bottom: 12px;
    }

    /* Radar Chart Styles */
    .radar-chart {
      width: 100%;
      height: 100%;
    }

    .radar-circle {
      fill: none;
      stroke: #6b7280;
      stroke-width: 1.5;
    }

    .radar-axis {
      stroke: #6b7280;
      stroke-width: 1.5;
    }

    .radar-area {
      fill-opacity: 0;
      stroke-width: 3;
    }

    .radar-area.highlighted {
      stroke-width: 6;
    }

    .radar-area.faded {
      stroke-width: 2;
      opacity: 0.25;
    }

    .radar-label {
      font-size: 13px;
      fill: #9ca3af;
    }

    .radar-value {
      font-size: 13px;
      font-weight: 600;
      fill: #4b5563;
    }

    /* Tooltip Styles */
    .tooltip {
      position: absolute;
      background: white;
      padding: 8px 12px;
      border-radius: 4px;
      box-shadow: 0 2px 6px rgba(0,0,0,0.15);
      font-size: 14px;
      pointer-events: none;
      opacity: 0;
      transition: opacity 0.2s;
      z-index: 10;
      border: 1px solid #e5e7eb;
    }

    .tooltip-title {
      font-weight: 600;
      margin-bottom: 4px;
      color: #374151;
    }

    .tooltip-value {
      margin: 2px 0;
    }
  </style>

<div class="container">
    <div class="chart-container">
      <div class="chart-area" id="radar-chart-container"></div>
      <hr>
      <div class="note">
        Click on a vendor name to highlight their scores.
      </div>
      <div class="legend" id="chart-legend">
        <!-- Legend will be dynamically generated -->
      </div>

    </div>
  </div>

  <div id="tooltip" class="tooltip"></div>

  <script>

    // Tools Array with distinct colors for each extension
    const tools = [
      { name: 'Magical', color: '#4F46E5', favicon: '' },
      { name: 'LastPass', color: '#10B981', favicon: '' },
      { name: 'RoboForm', color: '#F59E0B', favicon: '' },
      { name: 'Dashlane', color: '#EC4899', favicon: '' },
      { name: 'Form Filler', color: '#6366F1', favicon: '' },
      { name: 'Lightning Autofill', color: '#DC2626', favicon: '' },
      { name: 'QuickForm', color: '#7C3AED', favicon: '' },
      { name: 'Autofill by Google', color: '#2563EB', favicon: '' },
      { name: 'Simple Form Fill', color: '#059669', favicon: '' }
    ];

    // Categories for comparison
    const categories = [
      'Ease of Use',
      'Password Management',
      'Cross-Platform Sync',
      'Custom Templates',
      'Data Security',
      'Privacy Focus'
    ];

    // Data for each category and tool
    const toolData = [
      {
        category: 'Ease of Use',
        'Magical': 96,
        'LastPass': 88,
        'RoboForm': 82,
        'Dashlane': 85,
        'Form Filler': 92,
        'Lightning Autofill': 78,
        'QuickForm': 91,
        'Autofill by Google': 89,
        'Simple Form Fill': 86,
        fullMark: 100
      },
      {
        category: 'Password Management',
        'Magical': 75,
        'LastPass': 95,
        'RoboForm': 92,
        'Dashlane': 94,
        'Form Filler': 65,
        'Lightning Autofill': 70,
        'QuickForm': 68,
        'Autofill by Google': 72,
        'Simple Form Fill': 60,
        fullMark: 100
      },
      {
        category: 'Cross-Platform Sync',
        'Magical': 91,
        'LastPass': 94,
        'RoboForm': 87,
        'Dashlane': 92,
        'Form Filler': 70,
        'Lightning Autofill': 75,
        'QuickForm': 80,
        'Autofill by Google': 90,
        'Simple Form Fill': 68,
        fullMark: 100
      },
      {
        category: 'Custom Templates',
        'Magical': 94,
        'LastPass': 76,
        'RoboForm': 89,
        'Dashlane': 82,
        'Form Filler': 80,
        'Lightning Autofill': 85,
        'QuickForm': 88,
        'Autofill by Google': 65,
        'Simple Form Fill': 83,
        fullMark: 100
      },
      {
        category: 'Data Security',
        'Magical': 88,
        'LastPass': 96,
        'RoboForm': 89,
        'Dashlane': 93,
        'Form Filler': 70,
        'Lightning Autofill': 86,
        'QuickForm': 83,
        'Autofill by Google': 90,
        'Simple Form Fill': 72,
        fullMark: 100
      },
      {
        category: 'Privacy Focus',
        'Magical': 87,
        'LastPass': 82,
        'RoboForm': 84,
        'Dashlane': 78,
        'Form Filler': 75,
        'Lightning Autofill': 93,
        'QuickForm': 90,
        'Autofill by Google': 75,
        'Simple Form Fill': 85,
        fullMark: 100
      }
    ];

    // Variables for tracking state
    let highlightedTool = null;

    // D3.js radar chart implementation
    function createRadarChart() {
      // Get the container dimensions
      const container = document.getElementById('radar-chart-container');
      const width = container.clientWidth;
      const height = container.clientHeight;
      const margin = { top: 40, right: 80, bottom: 40, left: 80 };

      // Calculate the center and radius of the radar chart
      const centerX = width / 2;
      const centerY = height / 2;
      const radius = Math.min(width - margin.left - margin.right, height - margin.top - margin.bottom) / 2;

      // Create the SVG element
      const svg = d3.select('#radar-chart-container')
        .append('svg')
        .attr('width', width)
        .attr('height', height)
        .attr('class', 'radar-chart');

      // Create a group element for the radar chart, centered in the SVG
      const g = svg.append('g')
        .attr('transform', `translate(${centerX}, ${centerY})`);

      // Angle scale - maps categories to angles
      const angleSlice = Math.PI * 2 / categories.length;

      // Value scale (radial)
      const valueScale = d3.scaleLinear()
        .domain([40, 100])  // Min and max values
        .range([0, radius]);

      // Create the circles for the radar grid
      const circles = [40, 60, 80, 100];

      circles.forEach(value => {
        g.append('circle')
          .attr('r', valueScale(value))
          .attr('class', 'radar-circle');
      });

      // Create the radial axes
      categories.forEach((category, i) => {
        const angle = i * angleSlice;
        const line = [
          [0, 0],
          [radius * Math.sin(angle), -radius * Math.cos(angle)]
        ];

        g.append('path')
          .datum(line)
          .attr('class', 'radar-axis')
          .attr('d', d3.line());

        // Add the category labels
        g.append('text')
          .attr('class', 'radar-label')
          .attr('x', (radius + 25) * Math.sin(angle))
          .attr('y', -(radius + 25) * Math.cos(angle))
          .attr('text-anchor', (i === 0 || i === categories.length / 2) ? 'middle' : (i < categories.length / 2 ? 'start' : 'end'))
          .attr('dominant-baseline', 'middle')
          .text(category);
      });

      // Add value labels to one axis
      circles.forEach(value => {
        g.append('text')
          .attr('class', 'radar-value')
          .attr('x', 0)
          .attr('y', -valueScale(value))
          .attr('text-anchor', 'middle')
          .attr('dominant-baseline', 'middle')
          .text(value);
      });

      // Create data points for each tool and category
      tools.forEach(tool => {
        const dataPoints = categories.map((category, i) => {
          const categoryData = toolData.find(d => d.category === category);
          const value = categoryData[tool.name];
          const angle = i * angleSlice;

          return {
            x: valueScale(value) * Math.sin(angle),
            y: -valueScale(value) * Math.cos(angle),
            value: value,
            category: category
          };
        });

        // Close the path by duplicating the first point
        dataPoints.push(dataPoints[0]);

        // Create the path
        g.append('path')
          .datum(dataPoints)
          .attr('class', 'radar-area')
          .attr('d', d3.line()
            .x(d => d.x)
            .y(d => d.y))
          .attr('stroke', tool.color)
          .attr('stroke-width', 3)
          .attr('fill', 'none')
          .attr('data-tool', tool.name);
      });

      // Create the tooltip
      const tooltip = d3.select('#tooltip');

      // Create radar data points for tooltip interactions
      tools.forEach(tool => {
        categories.forEach((category, i) => {
          const categoryData = toolData.find(d => d.category === category);
          const value = categoryData[tool.name];
          const angle = i * angleSlice;
          const x = valueScale(value) * Math.sin(angle);
          const y = -valueScale(value) * Math.cos(angle);

          g.append('circle')
            .attr('cx', x)
            .attr('cy', y)
            .attr('r', 5)
            .attr('fill', 'transparent')
            .attr('stroke', 'transparent')
            .attr('data-tool', tool.name)
            .attr('data-category', category)
            .attr('data-value', value)
            .on('mouseover', function(event) {
              const tool = d3.select(this).attr('data-tool');
              const category = d3.select(this).attr('data-category');
              const value = d3.select(this).attr('data-value');

              tooltip.html(`
                <div class="tooltip-title">${category}</div>
                <div class="tooltip-value" style="color: ${tools.find(t => t.name === tool).color}">${tool}: ${value}</div>
              `);

              tooltip
                .style('left', `${event.pageX + 10}px`)
                .style('top', `${event.pageY + 10}px`)
                .style('opacity', 1);
            })
            .on('mouseout', function() {
              tooltip.style('opacity', 0);
            });
        });
      });
    }

    // Create legend and handle interactions
    function createLegend() {
      const legendContainer = document.getElementById('chart-legend');

      // Create first row with first 3 tools
      const firstRow = document.createElement('div');
      firstRow.className = 'legend-row';
      legendContainer.appendChild(firstRow);

      tools.slice(0, 3).forEach(tool => {
        const legendItem = document.createElement('div');
        legendItem.className = 'legend-item';
        legendItem.setAttribute('data-tool', tool.name);

        let iconElement;
        if (tool.favicon && tool.favicon.trim() !== '') {
          // Use favicon if available
          iconElement = document.createElement('img');
          iconElement.src = tool.favicon;
          iconElement.alt = `${tool.name} icon`;
          iconElement.className = 'legend-icon';
          iconElement.style.width = '20px';
          iconElement.style.height = '20px';
        } else {
          // Use colored circle as fallback
          iconElement = document.createElement('div');
          iconElement.className = 'legend-icon';
          iconElement.style.backgroundColor = tool.color;
        }

        const textElement = document.createElement('span');
        textElement.className = 'legend-text';
        textElement.style.color = tool.color;
        textElement.textContent = tool.name;

        legendItem.appendChild(iconElement);
        legendItem.appendChild(textElement);
        firstRow.appendChild(legendItem);

        // Add click handler
        legendItem.addEventListener('click', () => {
          handleToolClick(tool.name);
        });
      });

      // Create second row with remaining tools
      const secondRow = document.createElement('div');
      secondRow.className = 'legend-row';
      legendContainer.appendChild(secondRow);

      tools.slice(3).forEach(tool => {
        const legendItem = document.createElement('div');
        legendItem.className = 'legend-item';
        legendItem.setAttribute('data-tool', tool.name);

        let iconElement;
        if (tool.favicon && tool.favicon.trim() !== '') {
          // Use favicon if available
          iconElement = document.createElement('img');
          iconElement.src = tool.favicon;
          iconElement.alt = `${tool.name} icon`;
          iconElement.className = 'legend-icon';
          iconElement.style.width = '20px';
          iconElement.style.height = '20px';
        } else {
          // Use colored circle as fallback
          iconElement = document.createElement('div');
          iconElement.className = 'legend-icon';
          iconElement.style.backgroundColor = tool.color;
        }

        const textElement = document.createElement('span');
        textElement.className = 'legend-text';
        textElement.style.color = tool.color;
        textElement.textContent = tool.name;

        legendItem.appendChild(iconElement);
        legendItem.appendChild(textElement);
        secondRow.appendChild(legendItem);

        // Add click handler
        legendItem.addEventListener('click', () => {
          handleToolClick(tool.name);
        });
      });
    }

    // Handle tool highlight/unhighlight
    function handleToolClick(toolName) {
      if (highlightedTool === toolName) {
        // If already highlighted, unhighlight
        highlightedTool = null;
        updateHighlighting();
      } else {
        // Highlight the selected tool
        highlightedTool = toolName;
        updateHighlighting();
      }
    }

    // Update the highlighting based on the selected tool
    function updateHighlighting() {
      // Update radar areas
      const radarAreas = document.querySelectorAll('.radar-area');
      radarAreas.forEach(area => {
        const tool = area.getAttribute('data-tool');

        if (highlightedTool === null) {
          // Reset all to normal
          area.classList.remove('highlighted', 'faded');
          area.style.strokeWidth = '3px';
          area.style.opacity = '1';
        } else if (tool === highlightedTool) {
          // Highlight the selected tool
          area.classList.add('highlighted');
          area.classList.remove('faded');
          area.style.strokeWidth = '6px';
          area.style.opacity = '1';
        } else {
          // Fade other tools
          area.classList.remove('highlighted');
          area.classList.add('faded');
          area.style.strokeWidth = '2px';
          area.style.opacity = '0.25';
        }
      });

      // Update legend items
      const legendItems = document.querySelectorAll('.legend-item');
      legendItems.forEach(item => {
        const tool = item.getAttribute('data-tool');
        const textElement = item.querySelector('.legend-text');
        const iconElement = item.querySelector('.legend-icon');

        if (highlightedTool === null) {
          // Reset all to normal
          item.style.opacity = '1';
          textElement.style.fontWeight = 'normal';
          iconElement.style.border = 'none';
          iconElement.style.boxShadow = 'none';
        } else if (tool === highlightedTool) {
          // Highlight the selected tool
          item.style.opacity = '1';
          textElement.style.fontWeight = 'bold';
          iconElement.style.border = `2px solid ${tools.find(t => t.name === tool).color}`;
          iconElement.style.boxShadow = '0 0 0 2px rgba(0,0,0,0.1)';
        } else {
          // Fade other tools
          item.style.opacity = '0.5';
          textElement.style.fontWeight = 'normal';
          iconElement.style.border = 'none';
          iconElement.style.boxShadow = 'none';
        }
      });
    }

    // Initialize the chart and legend
    document.addEventListener('DOMContentLoaded', function() {
      createRadarChart();
      createLegend();
    });
  </script
Client
Framer Template
Service Provided
Web Design, Web Development
The Goal:
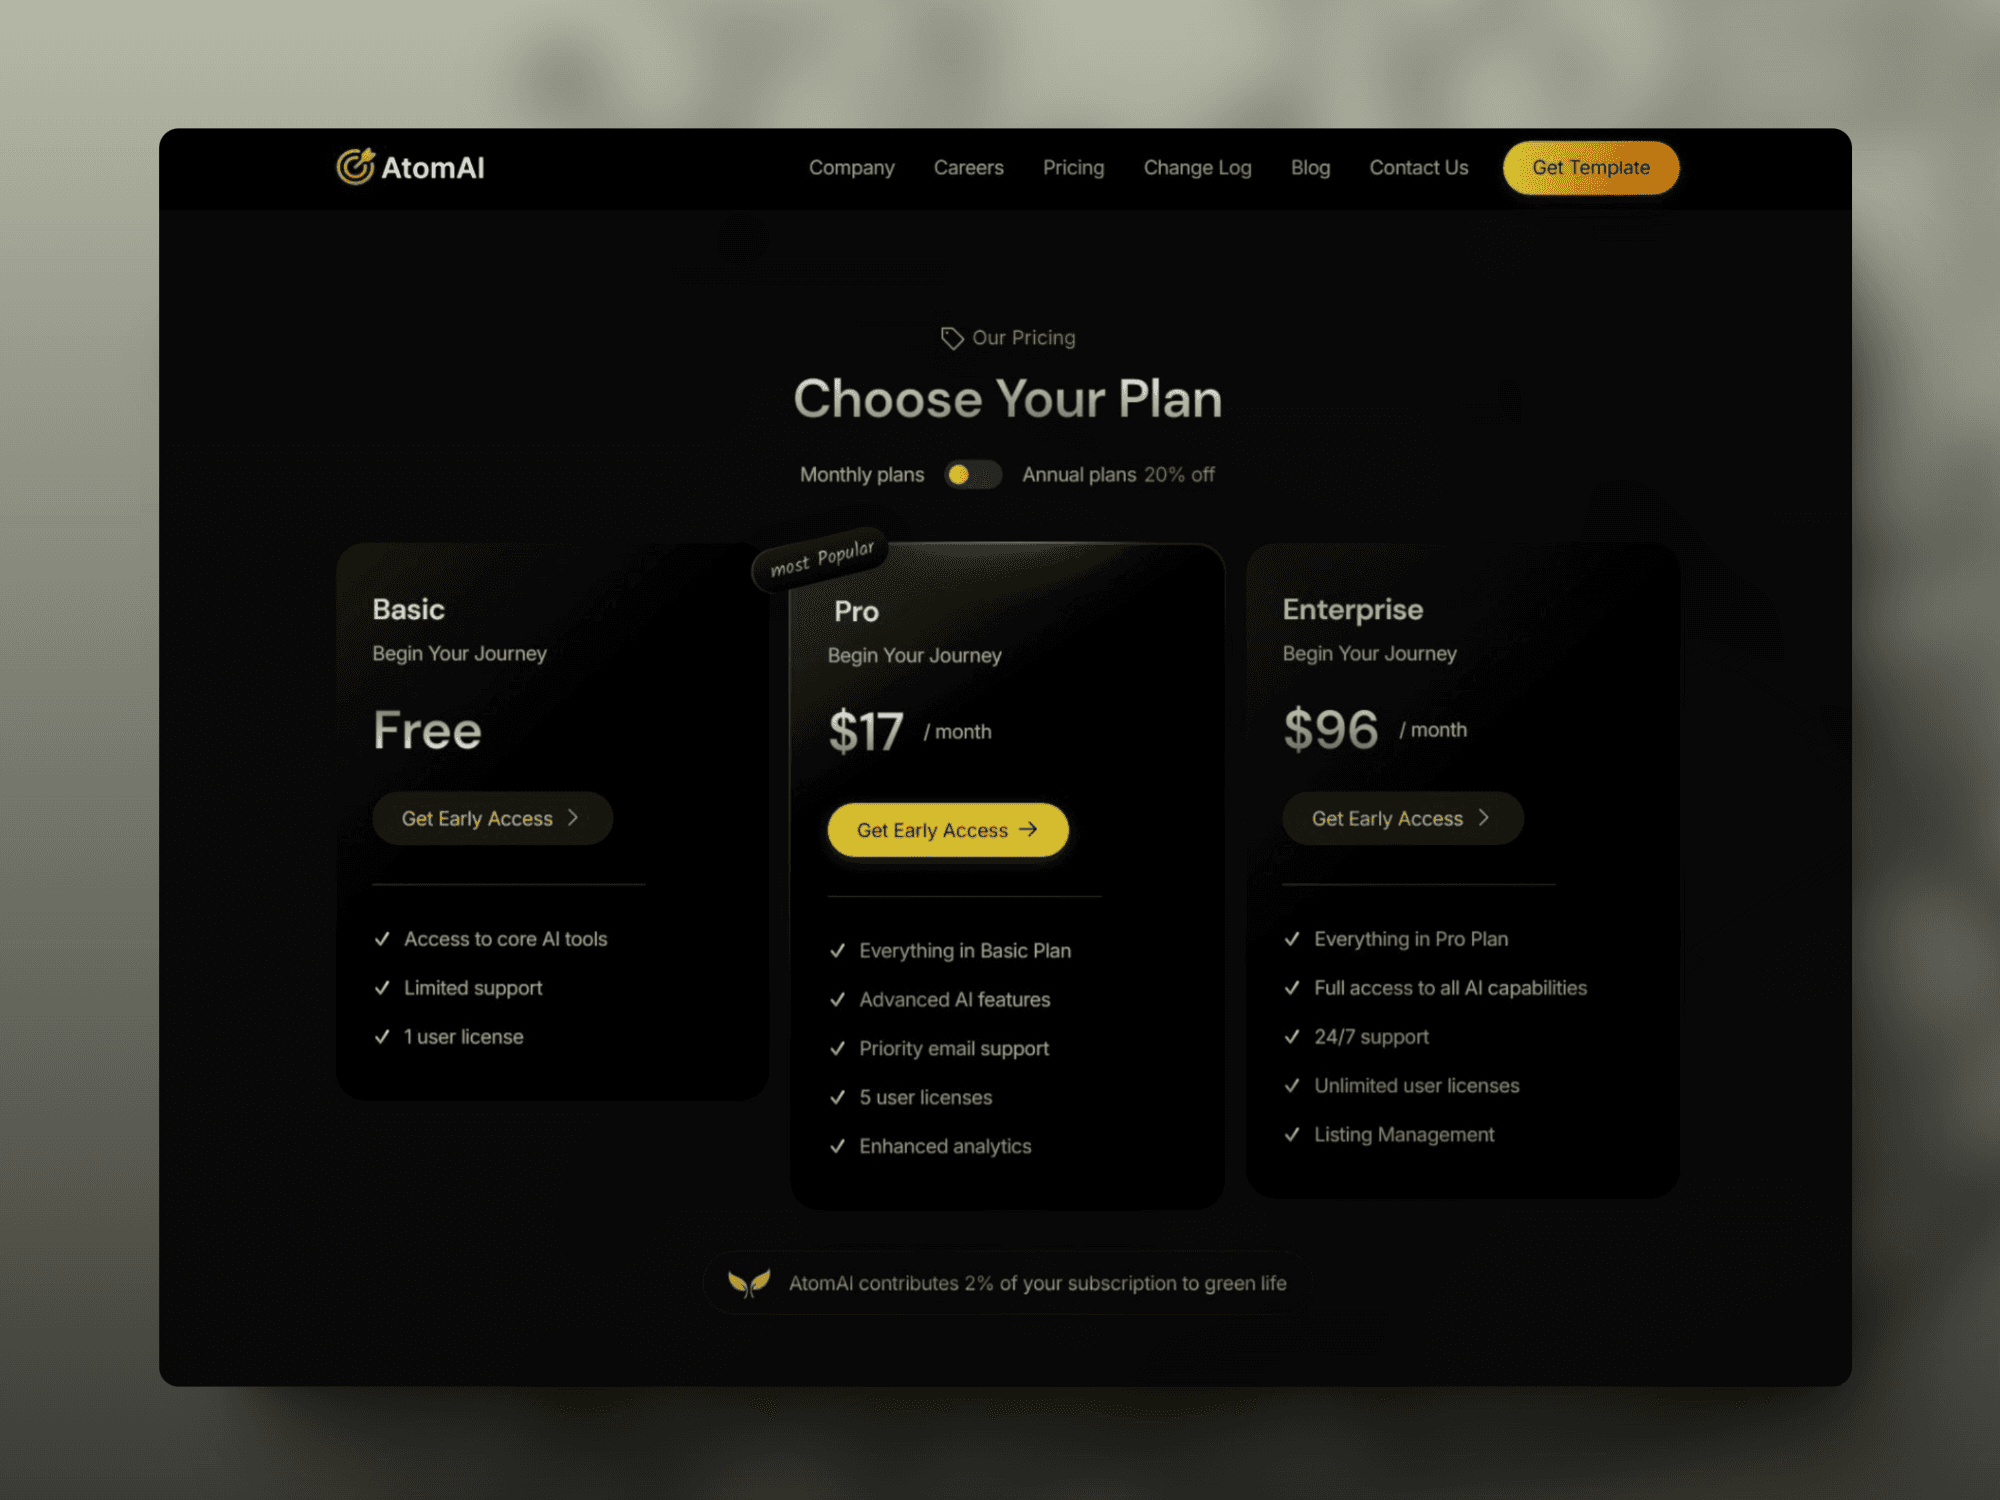
The primary goal of AtomAI is to provide businesses with an intuitive and cutting-edge SaaS template, seamlessly blending advanced features with sleek design. Designed for AI-related startups and enterprises, AtomAI empowers users to create world-class websites with ease.
1
The Challenge:
AtomAI is built to help businesses launch powerful, AI-driven websites effortlessly. This modern SaaS template combines innovation with sleek design, offering advanced features tailored for AI startups and enterprises. With AtomAI, creating a world-class online presence has never been easier.
2

The Result
In conclusion, AtomAI stands as the ultimate solution for AI-focused businesses and startups seeking a modern, professional, and feature-rich SaaS template. With its intuitive design, seamless functionality, and flexibility, AtomAI empowers users to craft stunning, high-performance websites that captivate audiences and drive growth.
3

Recent Designs